
Who Builds Anthropic and OpenAI? The AI Wave Behind 20,000 Résumés
Contents
Foreword
OpenAI and Anthropic are the world’s top AI large-model labs today, routinely grouped with Google DeepMind as the “Big Three.” At every moment, they are shaping how capital flows through the entire market.
Recently, Anthropic’s ARR growth diverged somewhat from market expectations, and a lot of stocks bounced around on the news. Someone joked that a single line in a private company’s quarterly numbers could shake the entire US semiconductor sector — imagine the circus once these companies actually go public. They are expected to potentially list in the third or fourth quarter of this year. And even if not this year, OpenAI’s CFO has said 2027 is certain.
So I wanted to study these companies from a different angle: beyond the enormous CapEx and the countless data centers they rent or build like steel monsters, who exactly are the people building the frontier models our daily lives now deeply depend on?
To find out, I went through more than 20,000 résumés. I should say up front that this piece was inspired by LatePost’s 2023 report on Binance written by Hanyang, and much of the structure here borrows from that report. We, too, took the 20,000 résumés collected from the internet and “copied them down line by line in pencil.” Please note: the information we collected is not necessarily accurate, cannot cover everything about these companies, and — more likely than not — is already outdated in an AI era that changes by the day.
So treat this as a playful, unofficial history of the AI companies. Do not take it as gospel.
LinkedIn officially shows 26,454 associated people. The résumés we could actually retrieve numbered 19,262 (Anthropic: 4,308; OpenAI: 8,421; DeepMind: 6,533). After further cleaning, 17,214 contained usable information. But this data is neither fully up to date nor fully transparent — a large share is missing or incomplete — so every conclusion here is an approximation. At best we glimpse one stripe of the leopard, not the whole animal.
The analysis centers on Anthropic and OpenAI: partly because they started as startups, making them more representative and less understood by outsiders; partly because the data for DeepMind and Google is much murkier. Many people write “Google” on their résumé rather than “DeepMind,” so DeepMind’s numbers may differ from what we would initially expect. This piece mainly discusses Anthropic and OpenAI, with DeepMind’s data as a reference point for perspective.
We will look at the geographic distribution of these frontier AI companies — cities, countries, schools, talent sources, functions and languages — and dedicate a section to how many Chinese nationals work at these companies, and what their stories look like.
Cities and Countries
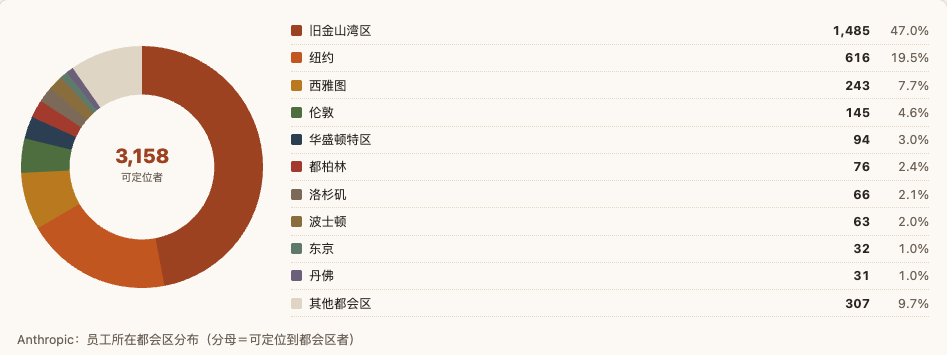
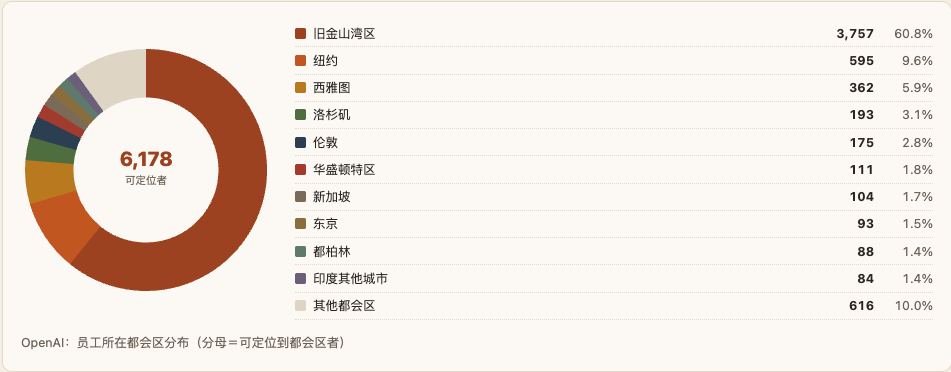
Among profiles that provide location data, the San Francisco Bay Area holds an absolute majority: 47% for Anthropic, 60.8% for OpenAI.
No surprise there — Anthropic and OpenAI were both born in San Francisco. Beyond that, staff are spread across major US cities: New York, Seattle, Washington, Los Angeles, Boston — all dense with universities and tech companies. Outside the US, three cities are worth noting:
-
London: Anthropic has 145 employees there, OpenAI has 175.
-
Dublin: as the European sales or operations hub, Anthropic has 76 people, OpenAI has 88.
-
Tokyo/Singapore: Anthropic has 32 people in Tokyo, but OpenAI’s largest Asian city is actually Singapore (104 people), with 93 in Tokyo. This matches what I’ve been sensing on Twitter.
As for the remaining data — honestly, my read is that many of these users moved to the US for work but never updated their LinkedIn location from Germany or France. But anyway, I think the data still works as a rough reference for city and country distribution.
Schools
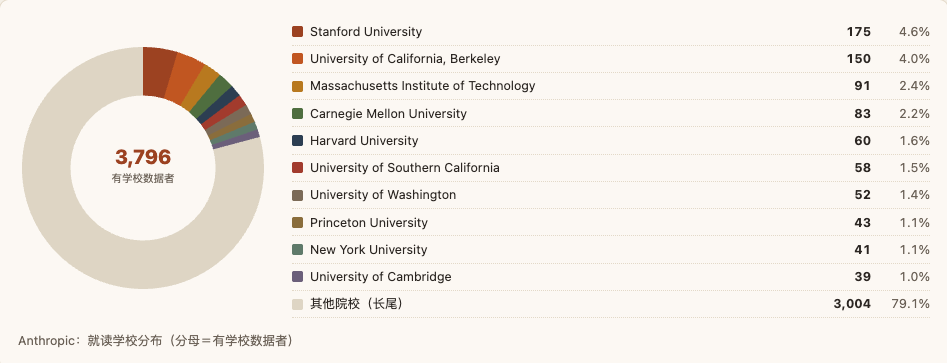
The school distribution has an even longer tail. Take Anthropic: the top 10 schools combined account for only 20.9%. You do see Stanford, Berkeley, MIT, Carnegie Mellon and Harvard as the standard top five — the standard target schools — contributing 14.7% of employees between them.
At the same time, the distribution is extremely long-tailed: the top 60 schools cover 47.9% of people, while the other half is scattered across another 1,308 schools, many with only one or two people each.
One counterintuitive example that surprised me: Northwestern has only 13 people, just 0.3% — placing it firmly in the long tail.
This distribution differs from what I expected. I assumed school concentration would be higher; it turns out not everyone is a researcher, which we’ll discuss in the functions section.
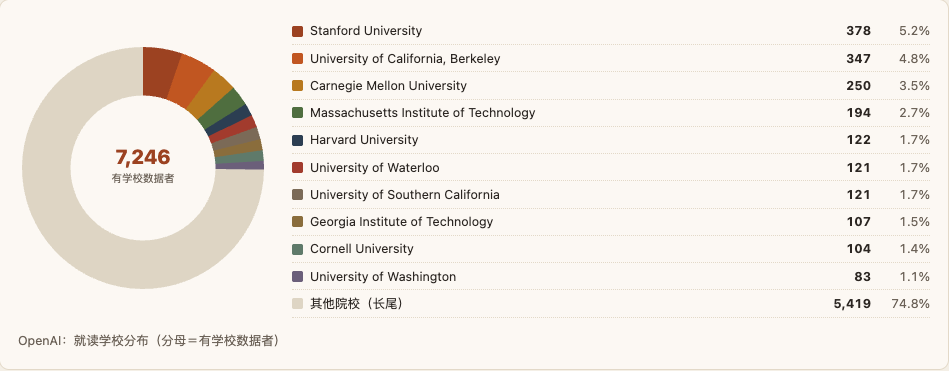
Interestingly, OpenAI’s numbers differ a bit: Waterloo ranks sixth there, higher than I would have guessed. The rest of the distribution resembles Anthropic’s. One more interesting detail: at OpenAI, 23 people come from Tsinghua University — 0.3%, higher than many American schools, and the only foreign university that ranks near the top.
At this point I know some haters will say: “Just look at OpenAI’s team photos — it’s all Tsinghua and Peking University people. America’s frontier labs are built by Chinese people. How can there be only 23 from Tsinghua?” Fair point. But here’s the problem: on LinkedIn, when I double-checked, many people I know for a fact graduated from Tsinghua never listed their first degree — they only wrote their master’s or PhD at Berkeley or Stanford. Statistically, they don’t show up as Tsinghua alumni. I know they are, but I can’t enumerate them one by one, so take this as a rough sketch.
Previous Employers
Take Anthropic: of its 4,000-plus résumés, over 2,700 list an employer (more than 1,000 either left it blank or had the information masked by the platform).
Of those, some fall within the top 40 employers and some don’t. As you’d imagine, the top-40 employer list reads like a ranking of big tech companies.
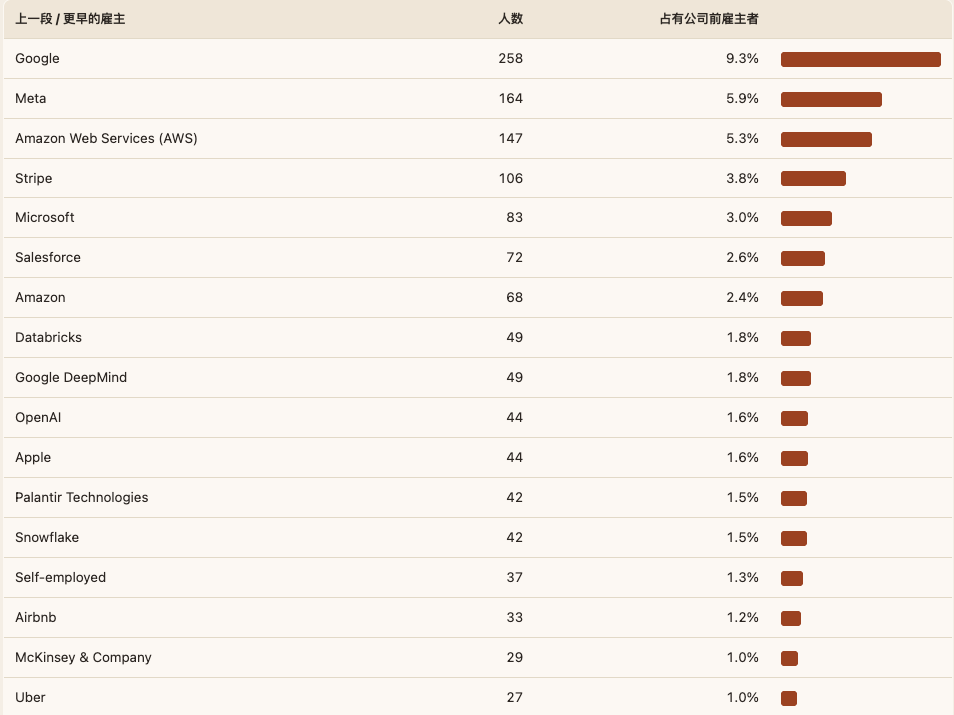
Previous employers of Anthropic staff:

Among valid samples that clearly list a previous employer, the top three talent sources are Google, Meta and AWS.
A fun detail here: Amazon Web Services and Amazon are listed as two separate companies on LinkedIn, and many employees deliberately mark themselves as working for AWS rather than Amazon. This probably has to do with Amazon’s enormous headcount and some people wanting to signal their business unit precisely.
Beyond that, the biggest startup feeder into Anthropic is Stripe, with 106 people — 3.8% of the valid sample, enough for a decent alumni group chat. This seems related to Anthropic co-founder Daniela having spent a long stretch of her career at Stripe.
OpenAI’s distribution looks very similar. OpenAI has 5,028 profiles with a previous employer or clear new-graduate status. But its top three employers are Meta, Google and Apple; the top five are Meta, Google, Apple, AWS and Microsoft. The single biggest startup contributor is Statsig — because OpenAI acquired the company, 129 employees walked in the door as a package deal.
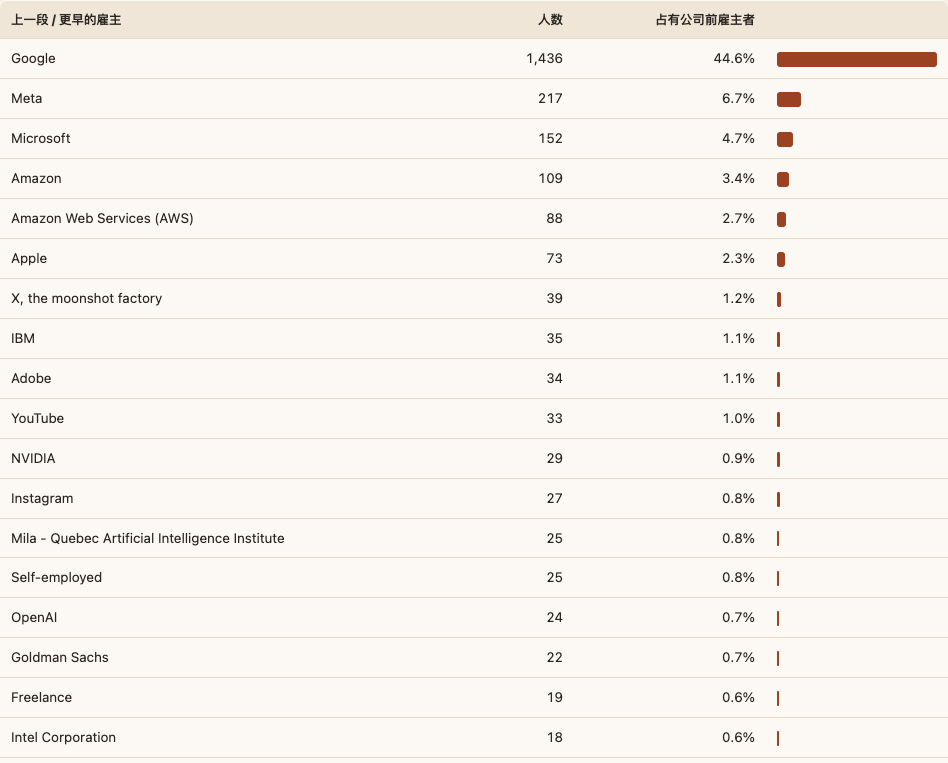
A side glance at DeepMind: the broad distribution is similar, but the previous-employer mix differs. Number one, of course, is Google, at 44.6% of the sample. Notably, 39 people come from Google X (1.2%); even Windsurf contributed 16 — fewer than Goldman Sachs’s 22.
Flip the question around: among OpenAI employees, 426 had Google as their last job; at Anthropic, 258 did. That’s 600-plus people from Google — the Google system really is the largest talent exporter to both. Working at Google and watching colleague after colleague leave for new startups must generate its own peer pressure.
The Talent War Between Labs
I know what you want to ask:
-
How many people left Anthropic for OpenAI? Who?
-
How many left OpenAI for DeepMind? Who?
-
How many left DeepMind for Anthropic? Who?
On this triangular talent war, I don’t trust the data I got. The sample is too small, and re-checking revealed flaws, so I won’t spread rumors here. If you’re really curious, leave a comment and I’ll go through them one by one.
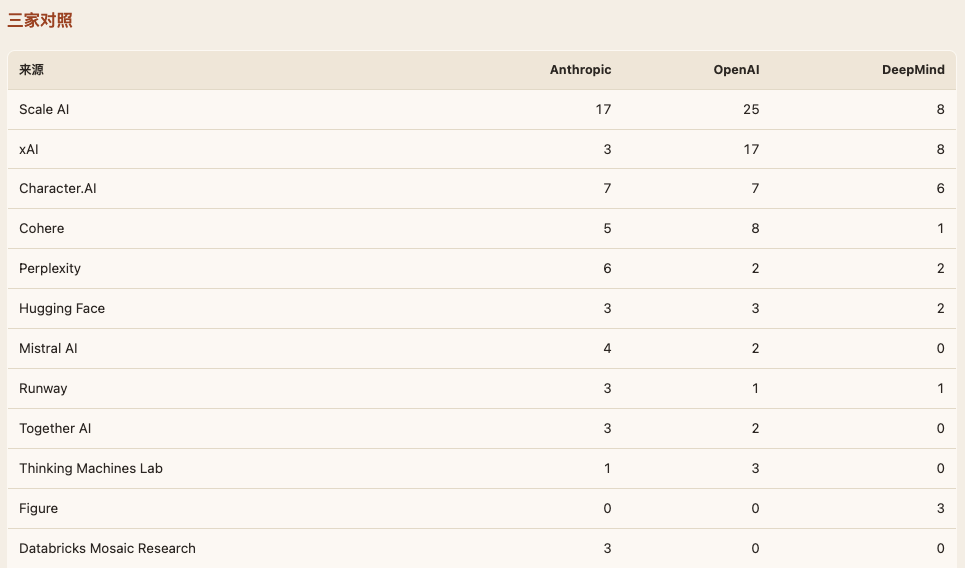
Second-tier labs feed the top three. What’s recorded here is the number of people the top three labs absorbed from second-tier labs.
Functions
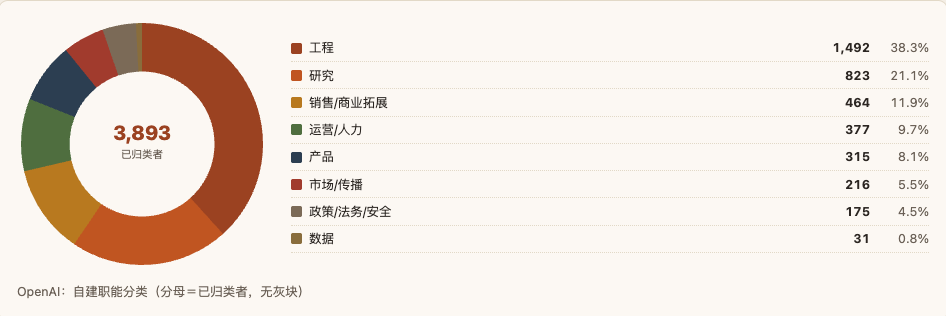
What do these people actually do? I built a function classification, because LinkedIn’s own data is bizarre — it will even list “entrepreneurship” as a job function, which is clearly unreasonable. My method: concatenate each person’s profile title, personal description and company position into one text blob, then classify by mutually exclusive keyword rules — first match wins — with priority running from research roles down to data roles. Sample situation: of the 4,000-plus people, about 70% (3,000) had analyzable data, of whom 1,890 could be cleanly classified — roughly half of all résumés.
I therefore think the results are reasonably representative and worth sharing.
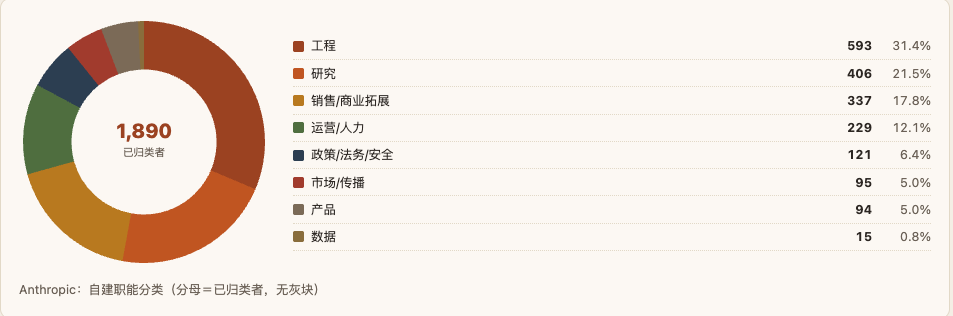
Under the same methodology, OpenAI and Anthropic show subtle differences:
-
Engineering ratio: OpenAI’s share of engineers is relatively higher.
-
Sales ratio: OpenAI’s share of salespeople is actually not higher than Anthropic’s.
-
Policy, legal and safety: in absolute numbers OpenAI is larger, but as a share of staff, Anthropic is much higher.
One clarification: if someone’s title is Member of Technical Staff, my classification puts them under “research” rather than “engineering.” I recognize this is somewhat biased, but there is genuinely no clean way to determine whether such a person does research or engineering. I suspect even the company couldn’t say, so I made this judgment call.
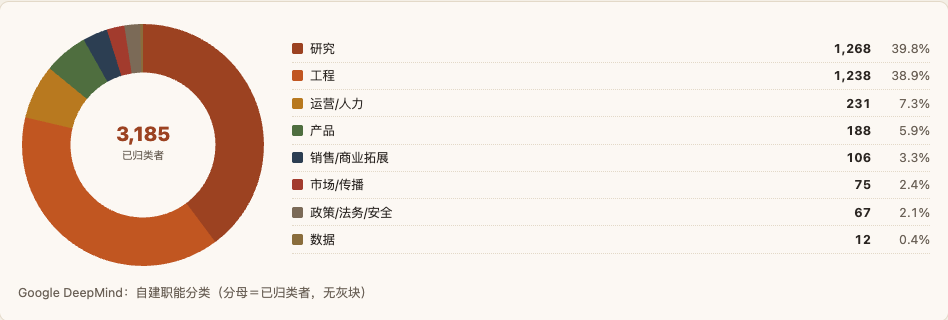
Look at Google DeepMind’s function breakdown and you’ll find their research-plus-engineering share far exceeds Anthropic’s and OpenAI’s. The absolute headcount in other functions isn’t necessarily small, but the ratios are much lower. My suspicion: many functions — sales, product, legal, data — are partly absorbed by the parent company Google, so the headcount taxonomy differs.
Note that we did as much processing and cleaning as we could. Personal histories leave lots of room for embellishment — many current students list themselves as OpenAI campus ambassadors; some influencers who took a single sponsored gig write “Content Creator at Anthropic” on LinkedIn. We did our best to identify and handle these cases, but 100% accuracy is impossible. So we read the macro distributions for the overall trend, and make no accuracy guarantees at the micro level.
A byproduct: if instead of classifying people into departments we simply scan their skills as keywords and build a word cloud, the high-frequency terms look like this:

What Languages Do They Speak?
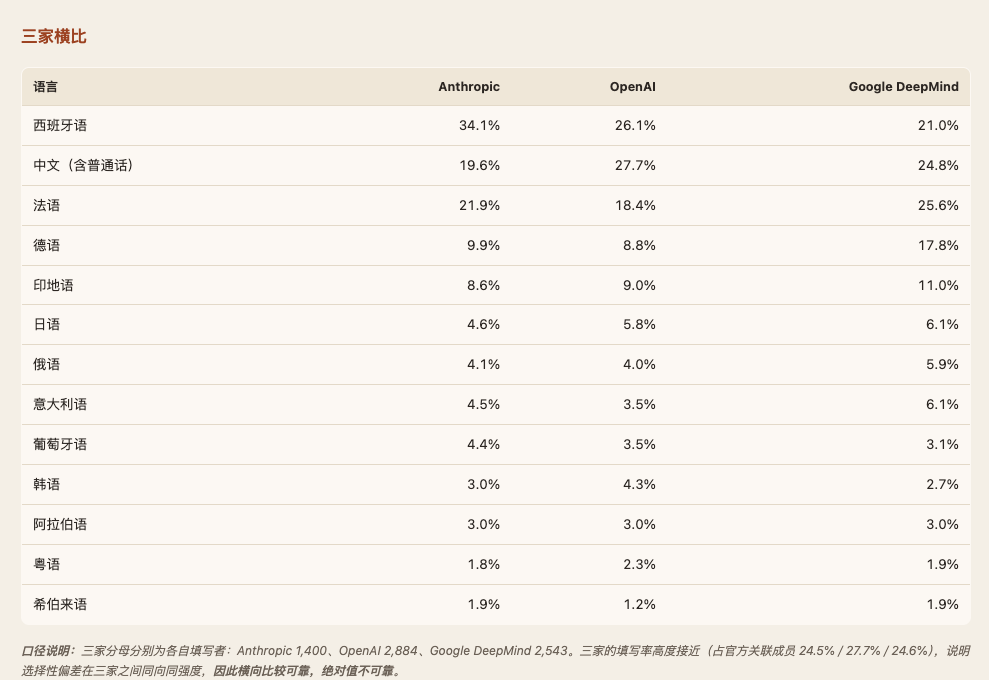
Many people tag the languages they speak on LinkedIn — though nobody tags English, since it’s assumed by default.
Among people educated in the US, Spanish and French are naturally the most common second languages. But Chinese accounts for 20-something percent on average here, which I think roughly matches the reality of ethnic Chinese employees at these companies.
How Many Chinese Nationals?
Social media loves to claim that the US–China large-model race is really a competition between Chinese people in America and Chinese people in China. Whether that’s true, we can’t say for certain — but the data offers some clues. This was one of the observations I most hoped this analysis would surface.
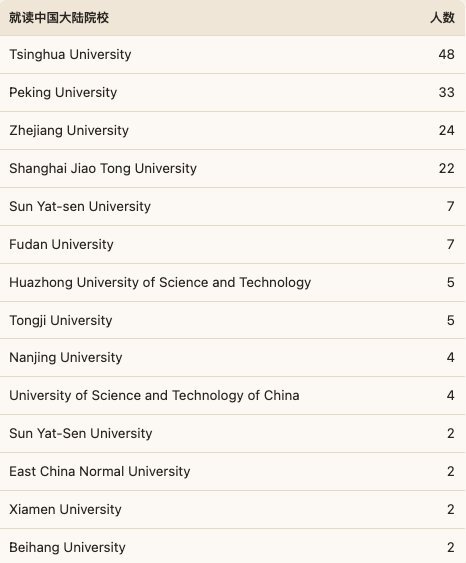
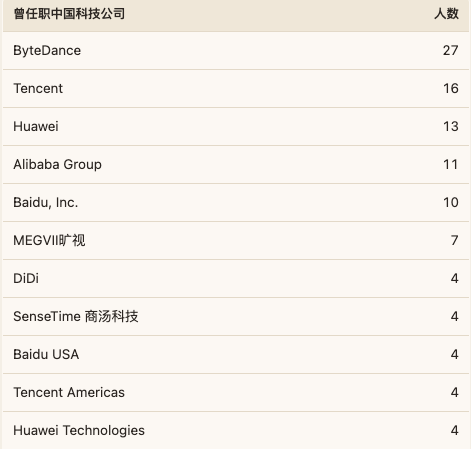
First: among these 20,000 résumés, who has an unambiguous China background? Defined as: attended a Chinese university (say, Peking or Tsinghua), or worked at a clearly Chinese company (say, Alibaba or Tencent). Then we remove edge cases like Americans who traveled far to study Chinese in China, or Singaporeans who worked at Tencent’s Thailand office. After all that, 343 people remain.
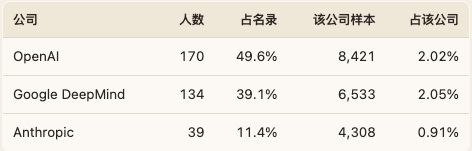
These are bona fide, dyed-in-the-wool Chinese nationals. Their universities are mainly Tsinghua, Peking, Zhejiang and Shanghai Jiao Tong (yes — Zhejiang and Jiao Tong, not Fudan and Jiao Tong), and their Chinese work experience is mainly at BAT and Huawei (where the B stands for ByteDance).
To be perfectly clear: those 343 do not include Dario, who once worked at Baidu. I pulled that name out separately — he’s not in there!
Reading these profiles closely, many did their undergrad in China and then went abroad for a master’s or PhD — mainly at Berkeley, Carnegie Mellon, Stanford, USC and UCLA. They also worked at top foreign companies including Google, Microsoft, Meta, Amazon and Nvidia, before joining the Big Three at various points in the past two or three years.
So How Many Chinese, Really?
By now you must be thinking this number can’t be right. You’ve seen so many Chinese faces in videos and podcasts, names all in pinyin, most of them at least plausibly ABC — how can they be under 2% of the company? That’s what I thought too, so I dug further.
Going back to the largest sample, among 19,262 records:
-
Clearly pinyin full names: 1,520
-
Common pinyin surnames: 1,432
To explain the “common pinyin surname” logic: someone named Wang Jianguo goes by Tony and writes “Tony Wang.” That counts as a common pinyin surname — provided the spelling is the mainland pinyin “WANG.” If it’s “WONG,” they go into the overseas-Chinese (non-pinyin) group. The pinyin groups total 2,952 people, with relatively high confidence. That’s 15% of all résumés — a number that sounds much more reasonable.
But honestly, a pinyin name could still belong to an ABC born and raised in America. For all we know, they like China less than that white American who went to East China Normal University to study Chinese.
Here I want to cite a statistic from Harvard’s undergraduate Class of 2029 (the 1,675 students who enrolled in 2025).
The official numbers:
-
Asian American: 41% (East Asian, Southeast Asian and South Asian bundled together; no official breakdown)
-
Black: 11.5%
-
Hispanic: 11%
-
Race not reported: 8%
-
White: essentially the remainder
The common third-party estimate splits the 41% Asian share into two-thirds East Asian and one-third South Asian (an external estimate, not official data, but usable as a rough mapping). That gives East Asians 27% and South Asians 14%.
If pinyin-named students are 15%, then other East Asian students (Hong Kong, Macau, Taiwan, Singapore, Japan, Korea, etc.) make up the other 12% — which also sounds reasonable, and matches the crowd you’d actually see at an Ivy League school. Harvard freshman admissions correlate strongly with Silicon Valley’s current talent mix, so this works as a sanity check.
And as mentioned earlier, among people with language tags, Chinese speakers are 20-something percent of the sample — which surely includes the 15% with pinyin names, plus ethnic Chinese from Hong Kong, Macau, Taiwan, Southeast Asia, and other immigrant communities in America, rounding up to 20-plus percent. Got another way to estimate this? Leave me a comment.
Interesting Findings
-
Across location, schools, previous employers, functions, languages — even the share of Chinese speakers — these three companies are highly similar. Almost too similar: profoundly homogeneous competition. If you don’t read the fine print on those charts, they look like one company. Swap the names and you couldn’t tell which chart is really Anthropic and which is really OpenAI.
-
Anthropic is more commercialized than I expected: quite a lot of business development and sales staff. Then again, for a company selling to businesses, going hard on the B side makes sense.
-
In the supposedly most core AI safety and alignment function, headcount share is 2.3% — reportedly double OpenAI’s. But I honestly don’t know: is 2.3% for safety and alignment a lot or a little? Is it enough? And if not, how much would be?
-
Zhejiang University is genuinely impressive!
-
DeepMind is the only lab where Oxford and Cambridge rank at all — at the other two, Oxbridge graduates have zero presence. Mostly because DeepMind started in London.
-
In Anthropic’s résumé pool, 44 people have OpenAI on their résumé — meaning they moved from OpenAI to Anthropic. The reverse flow (Anthropic to OpenAI) is just 9 people. The data points are too few to be confident, but I suspect the direction of the ratio is right.
-
Reading those 343 China-background résumés, I found a lot. The life stories are genuinely interesting. Some of these people belong on a podcast. Let me go through their material first — when I’m ready to invite them, I’ll come find you!
Regrets
-
Internal promotion paths couldn’t be tracked: some time-series data wasn’t recorded well, so we can’t tell when people joined or whether their roles changed.
-
Departures couldn’t be tracked: we can only count current employees, not where people who left OpenAI went. That’s genuinely interesting information — choosing to start a company or join another after OpenAI signals conviction about some direction, and would probably carry more investment-reference value. (I haven’t figured out how to do this effectively; the technical approach needs more thought. Ideas welcome!)
-
Graduation-age statistics missing: I originally wanted to compute everyone’s college graduation age, but botched the time data during processing and don’t plan to redo it. My guess is the conclusion would simply be that people at all three companies are pretty young.
Got a good angle for squeezing more value out of this data? Leave me a comment. I’ve read 20,000-plus résumés and my brain has gone slightly numb — I could genuinely use your help brainstorming. Thank you!
If you're working on this too — or you think we've got it wrong — write to us at [email protected]; if you'd rather not write, just leave your email below.
New conversations and research, delivered to your inbox.